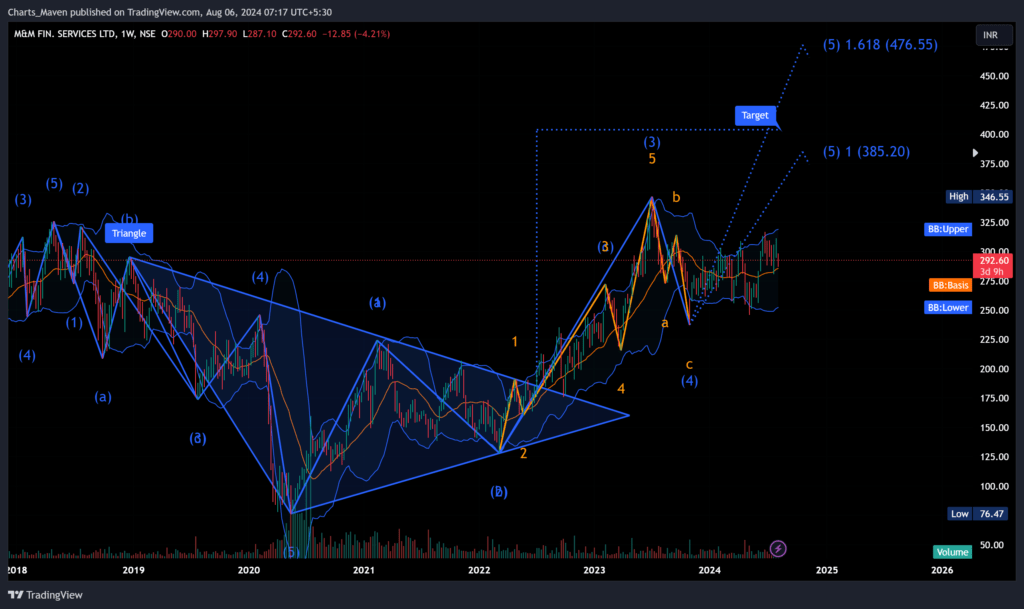
by Dhara Hariya | 06/08/24 | Long Term
M&M Financial Services has been taking a breather after reaching a 52-week high of ₹346.55. However, recent chart patterns suggest that the stock might be ready to break out of this consolidation phase. Let’s explore the technical and fundamental factors...
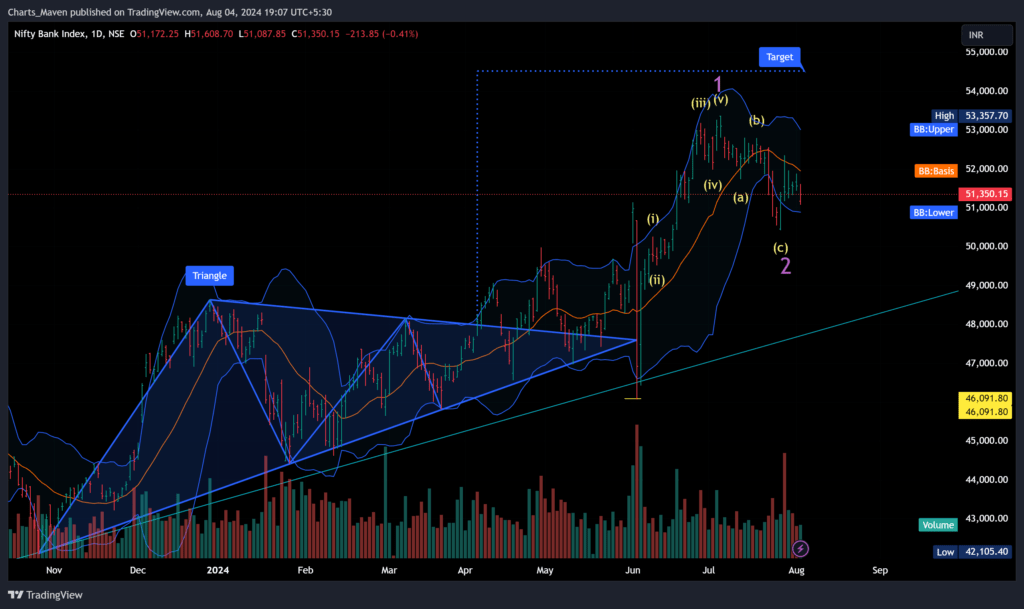
by Dhara Hariya | 04/08/24 | Bank NIFTY, Indian Stock Market
The Bank Nifty index is currently exhibiting an intriguing technical setup, with a triangle pattern formation suggesting a potential breakout. The index recently underwent a correction from a high of 53,357 to a low of 50,427. A key observation is that the index has...
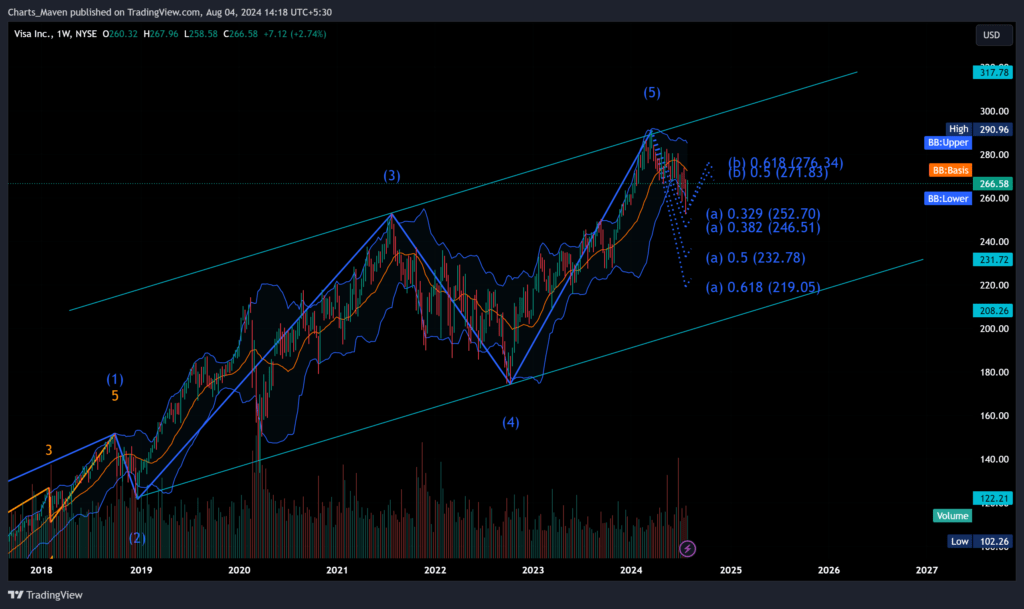
by Dhara Hariya | 04/08/24 | Forex, Stock
The technical chart of Visa Inc. (V) indicates that the stock is currently undergoing a corrective phase after a strong upward trend. This correction is represented by the A-B-C pattern, a common pattern in Elliott Wave Theory. Key technical indicators supporting this...
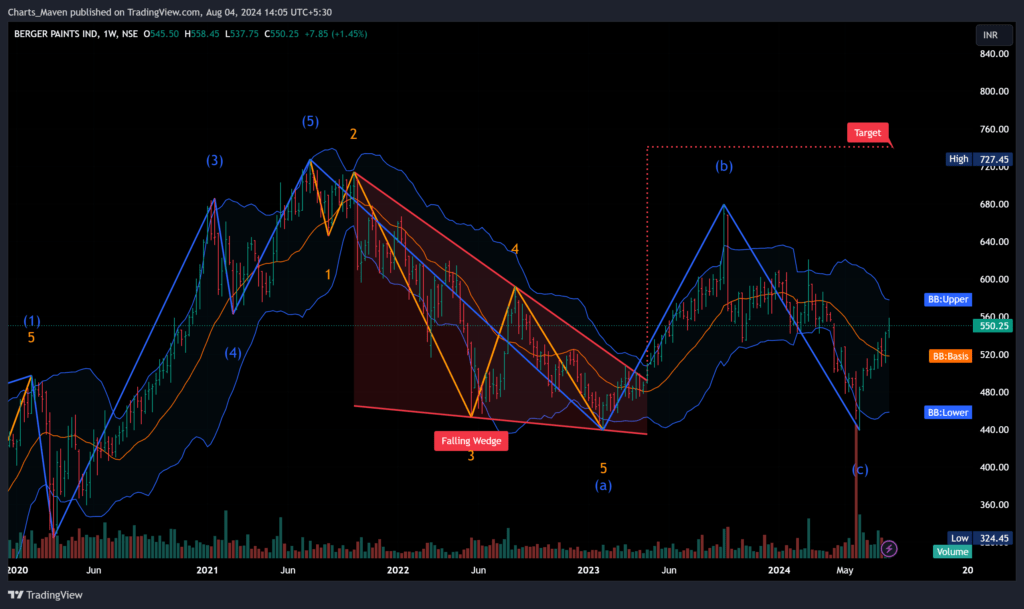
by Dhara Hariya | 04/08/24 | Indian Stock Market, Medium Term
Introduction Berger Paints is a leading Indian paint company with a strong presence in the decorative and industrial paints segments. The company’s stock has been on a tear in recent months, and it is currently trading near its 52-week high. In this blog post,...
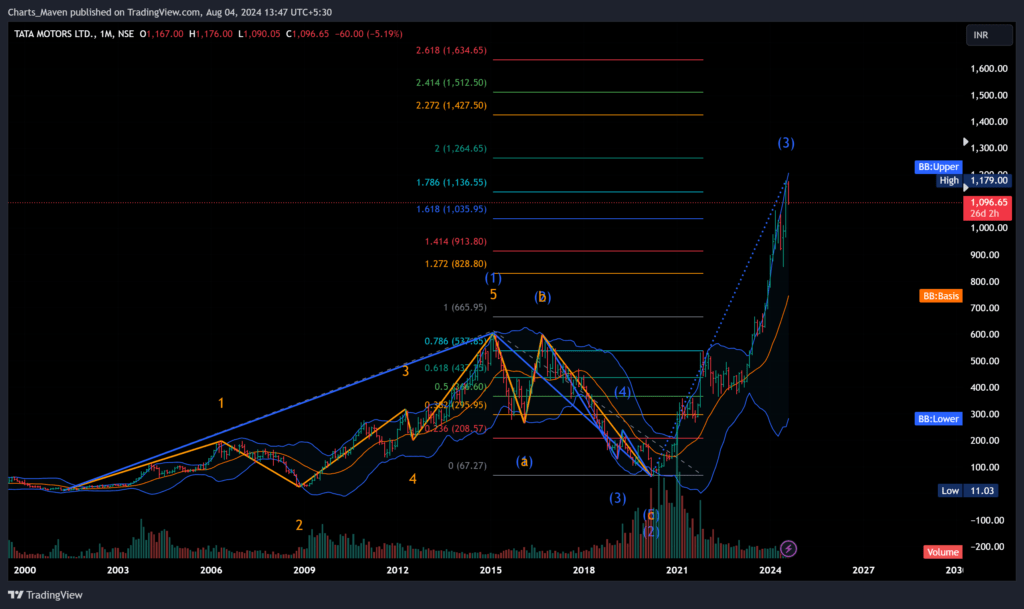
by Dhara Hariya | 04/08/24 | Indian Stock Market, Long Term
TATA Motors Ltd. : Riding High on Wave 3 The stock price of TATA Motors Ltd. (NSE: TATAMOTORS) is on a remarkable upward trajectory, currently trading near its all-time high. Through the lens of Elliott Wave analysis, we find that this impressive rally aligns with the...