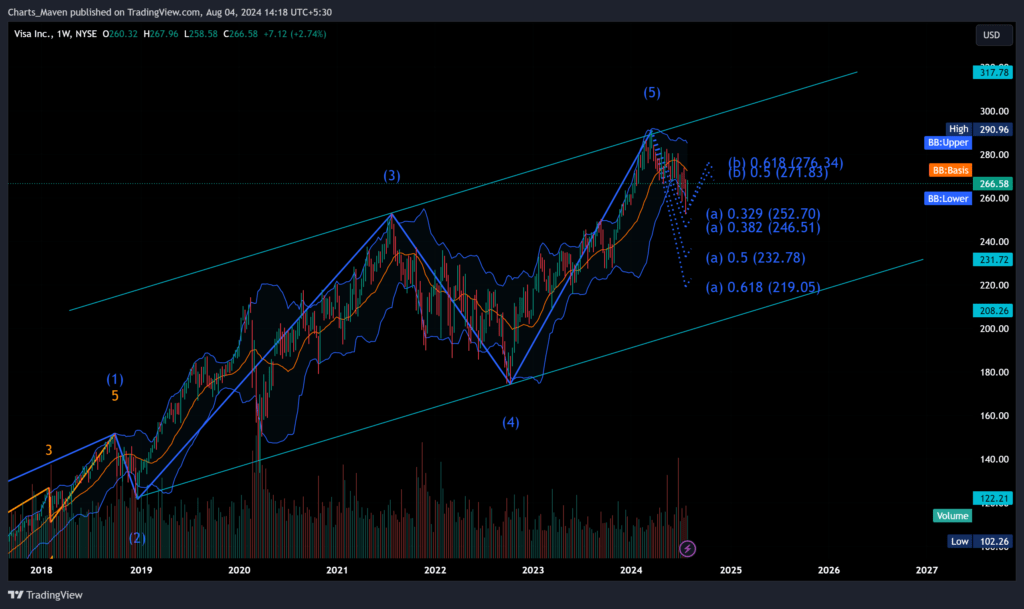
The technical chart of Visa Inc. (V) indicates that the stock is currently undergoing a corrective phase after a strong upward trend. This correction is represented by the A-B-C pattern, a common pattern in Elliott Wave Theory.
Key technical indicators supporting this analysis include:
- Fibonacci Retracement Levels: The stock’s price is currently testing key Fibonacci retracement levels, which could act as potential support or resistance areas.
- Bollinger Bands: Visa’s price is trading near the lower Bollinger Band, suggesting the stock may be oversold.
- Volume: The trading volume has decreased during the corrective phase, a typical characteristic of retracements.
Elliott Wave Theory and Potential Price Target
According to Elliott Wave Theory, the current correction could lead the stock price to reach around $240, marking the completion of the C wave in the A-B-C pattern. This level aligns with key Fibonacci retracement levels and could serve as a potential entry point for investors.
What This Means for Investors
The current corrective phase could present an opportunity for investors who missed the initial upward trend. If the stock finds support at the current levels or around the $240 mark, it could potentially resume its upward trajectory. However, investors should closely monitor the technical indicators and consider fundamental factors before making any investment decisions.
Disclaimer: This blog post is for informational purposes only and should not be taken as financial advice. Always conduct your own research and consult with a financial advisor before making any investment decisions.