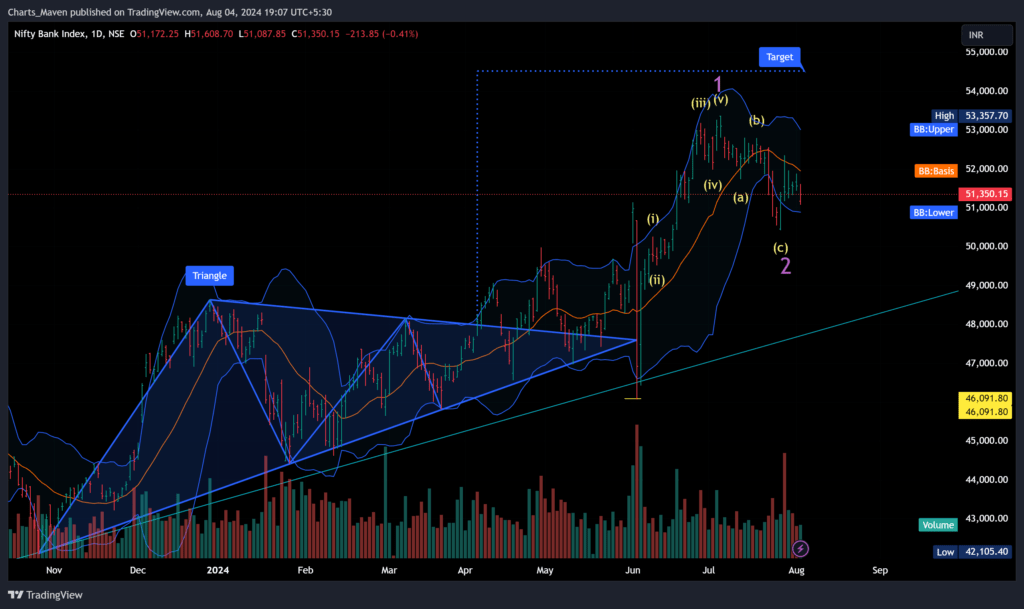
The Bank Nifty index is currently exhibiting an intriguing technical setup, with a triangle pattern formation suggesting a potential breakout. The index recently underwent a correction from a high of 53,357 to a low of 50,427.
A key observation is that the index has found support at the 50,427 level and is now attempting to reach the triangle pattern’s target of 54,520. If the index manages to maintain its current momentum and avoid breaking below the 50,427 support, a breakout to the upside could be in the cards.
However, traders and investors should exercise caution. A break below the 50,427 support level could invalidate the bullish outlook and potentially lead to a downward move towards 48,873.
Key Levels:
- Resistance: 54,520 (triangle pattern target)
- Support: 50,427 (recent low)
- Potential Downside Target: 48,873
Elliot Wave Analysis
The Elliot Wave analysis suggests that the Bank Nifty index is currently in wave (c) of a larger wave (5). Wave (c) is typically a corrective wave that retraces a portion of the gains made in wave (a). If the index can complete wave (c) and break above the resistance at 54,520, it could move up to the target of 55,000.
However, if the index fails to break above the resistance and falls below the support at 50,427, it could indicate that wave (c) is not yet complete. In this case, the index could fall further to the target of 48,873.
Fundamental Analysis
The Bank Nifty index is a benchmark index for the Indian banking sector. The index is composed of the 12 largest and most liquid banking stocks in India.
The Indian banking sector is expected to grow at a CAGR of 12% over the next few years. This growth is being driven by a number of factors, including the increasing demand for credit from Indian businesses and consumers, the government’s focus on financial inclusion, and the growing adoption of digital banking.
The Bank Nifty index is a good proxy for the Indian banking sector. As such, it is an attractive investment for investors who are looking to gain exposure to the Indian economy.
Conclusion
The Bank Nifty index is at a critical juncture, with a triangle pattern suggesting a potential breakout. If the index can hold above the 50,427 support, the target of 54,520 becomes a realistic possibility. However, a break below this support could trigger a downward move. Traders should closely monitor price action and manage their risk accordingly.
Disclaimer: I am not a financial advisor and this is not financial advice. Please do your own research before making any investment decisions.
I hope this blog post is helpful. Please let me know if you have any questions.
Additional Notes:
- The Elliot Wave analysis is a technical analysis tool that can be used to identify potential turning points in the market.
- The fundamental analysis is an analysis of the underlying fundamentals of a company or industry.
- The blog post is intended for informational purposes only and should not be considered as investment advice.